Read the fleet
Track every vessel approaching the port in real time: speed, position, navigational status and declared ETA.

Know what’s ahead of your vessel.
AI-powered port intelligence for shipping. See the queue. Plan the voyage. Arrive informed.
Explore PharosBUILT FOR SHIPPING. DESIGNED FOR BETTER DECISIONS.
01 / THE CHALLENGE
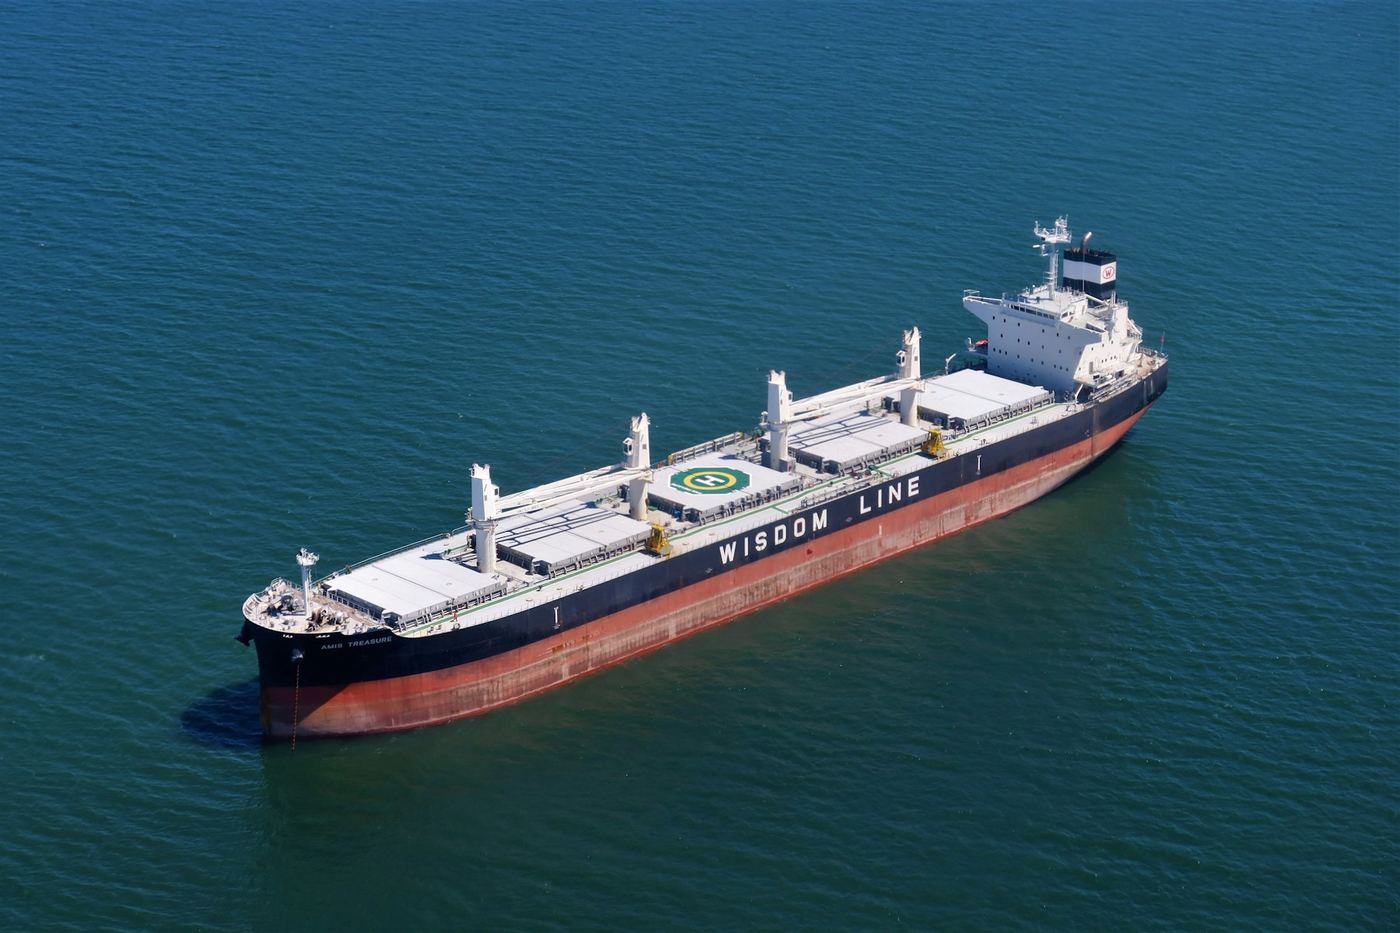
Vessels race to port, only to wait at anchor for days. Under charter party terms the ship is obliged to sail at maximum contracted speed, so it does, regardless of what is actually happening at the terminal.
The missing piece is knowing what’s waiting at the other end. Pharos turns AIS vessel data into a clear picture of port queues, helping operations teams act before a vessel even departs.
Sail fast, then wait.
THE INDUSTRY’S OWN NAME FOR THE BEHAVIOURIdle time is no longer only an operational cost. Fuel burned racing to an occupied berth worsens a vessel’s CII, and since 2024 every anchor day near an EU port carries a carbon price under the EU ETS.
02 / THE PLATFORM
Track every vessel approaching the port in real time: speed, position, navigational status and declared ETA.
Build a live picture of the anchorage: how many vessels are waiting, how the queue is moving, when the next berth window opens.
Combine live AIS with historical port patterns: service times, berth turnover and seasonal congestion cycles.
A clear arrival window and the data behind it. The decision, and the vessel, always stay with your team.
No port integration required. No hardware on board. Built around the way your team already works, and live in weeks.
03 / THE RESULTS
Each voyage the model processes tightens its picture of that port: service times, berth turnover, how the queue behaves through the season. The dataset compounds, the forecasts get tighter, and the recommendations improve for every vessel that follows. Measured against what ships actually did, the record so far:
VOYAGES IMPROVED
100%
Every voyage assessed so far has come out ahead of what the vessel actually did.
AVERAGE PER VOYAGE
$131,000
Median $88,650. Range $25,204 to $435,732.
BUNKER FUEL SAVED TO DATE
9,066 t
Recovered at the charter party speed floor, never past just-in-time.
CO₂ AVOIDED TO DATE
28,233 t
565 tonnes per voyage, straight off the vessel’s CII exposure.
04 / WHAT YOU GAIN
The same intelligence pays in four different currencies: cash, carbon, negotiating position and evidence. Here is how each one accrues.
Consumption rises with roughly the cube of speed. Converting a wait into slow steaming on the approach cuts main engine burn sharply, while arriving at the same berth, in the same hour.
Lower bunker burnON EVERY APPROACH
A day at anchor is paid for in hire, bunkers and anchorage fees while the ship earns nothing. Arriving when the berth opens removes the day rather than paying for it.
Days removedNOT PAID FOR
Hours spent stationary off a congested terminal push a rating down, and the thresholds tighten every year toward 2030. Arriving on time protects the band the vessel trades in.
Rating protectedVOYAGE BY VOYAGE
Shipping now falls under the EU ETS, so carbon burned on the approach to an EU port is a direct, invoiced cost. Less fuel is fewer allowances to surrender.
Fewer allowancesREDUCED AT SOURCE
One voyage is an operational detail. Repeated across a fleet and a trading year, the same effect stops being a detail and starts showing up in the annual result.
CompoundsACROSS THE FLEET
Continuous congestion history for a port, weeks before a fixture is signed, so laytime, demurrage rates and port rotation are argued from data rather than from memory.
At the fixtureBEFORE THE VOYAGE STARTS
A timestamped record of what the port actually looked like, including queue length, berth turnover and waiting times, for when a claim is disputed after the fact.
Objective recordPOST-VOYAGE
05 / THE NEXT VOYAGE
For operations teams, chartering departments and fleet managers in shipping. Tell us the ports you call at most and we will come back with a backtest on your own voyages.
ESTABLISHED IN ATHENS. WORKING ACROSS EUROPE AND THE UK.